
This blog was written for the Whale SENSE website by Whale SENSE naturalists Laura Howes (with Boston Harbor City Cruises) and Julie Taylor (with Bar Harbor Whale Watch Company)

Over the course of summer and fall of 2021 and 2022, whale watch naturalists from a handful of companies operating between Long Island and Maine collaborated with Tammy Silva of NOAA’s Stellwagen Bank National Marine Sanctuary and Andrew Thaler of Oceanography For Everyone. Two Whale SENSE companies, Bar Harbor Whale Watch Company and Boston Harbor City Cruises/New England Aquarium Whale Watch helped to conduct a community science project to learn more about the Gulf of Maine ecosystem and to educate the public about the role oceanographic research has in learning more about how it is changing.
Why do we want to know about how the ocean is changing and what does this have to do with whales?
In order to protect whales and other marine life, it is key to understand what is going on in the ocean-specifically the water quality. The water temperature and salinity are components of the ocean water that are closely linked to the abundance and distribution of prey items you find on the whale menu. This includes fish such as sandlance, menhaden, herring, and caplin and well as planktonic crustaceans like krill and copepods.
In essence, where there is fish and plankton, there is likely to be whales. And where the food is depends on the relationship between the water temperature and salinity, and what they are doing at various depths.
Whales can also be sentinels of the marine environment. Their movements over time and space time on feeding grounds can help us gauge the productivity or ecological health of a particular area or entire ocean ecosystem. But studying the water’s chemistry can give us a bit more detail about what is going on in the ocean.
So, how did we collect this information?
Working with Andrew’s Open CTD and Blackbeard Biological program, scientific instruments called CTDs (conductivity, temperature, and depth) were built and cast into the ocean from the decks of the whale watch boats while in the vicinity of whales. These kinds of instruments allow us to “see” what the water column looks like by collecting measurements that can be visualized on a graph against depth.

Before doing a cast the boats need to be at least 100 yards away (500+ yards if North Atlantic right whales are present). It is best to have crew and the naturalist be lookouts to visually keep track of whales and their location. This helps the captain and those casting the CTD do it safely. Some find that doing a cast before heading back to shore is a good time to do it as this allows passengers to focus on observing the process, learn about the project, and ask questions.
When casting the CTD, line over a hundred feet in length was attached to a weighted PVC pipe equipped with an internal circuit board and external sensors. How much weight used depends on the location. The Gulf of Maine tends to encounter strong tides and currents. To prevent the CTD from being pulled back toward the stern and making sure it went down vertically in the water column, most used an 8 pound mushroom anchor securely attached to the outside of the PVC pipe. Having a couple of crew available to help is key and is a great way to promote teamwork!
As it drops down at 1 meter per/second it collects temperature, salinity, and depth measurements every second. It is then brought to the surface, the data card is removed, and information is uploaded to a public accessible platform that helps to visualize the data to show us what is going on in the water column. All the while, onlooking passengers get to see how this kind of data is collected and witness science in action! It also helps them understand the importance of water columns and how they connect to large whales they see come to the surface. Ocean health is important from the smallest molecules to the largest of animals.
You have collected the data, now what?
After the manual labor of casting is complete, data and location of cast is uploaded and displayed on a map. You can view and download the data on the Community Oceanography While Watching Whales website. Another major aspect of this project is to make the data open source and accessible to the public to be used in other studies.

Looking at CTD data can seem a little confusing at first, but below are two different cast profiles taken at about the same time of year in separate locations in the Gulf of Maine. To the left, this cast is a location approximately 20 miles from Bar Harbor, Maine and to the right a cast taken just to the north of Stellwagen Bank National Marine Sanctuary, just due east of Gloucester, Massachusetts.

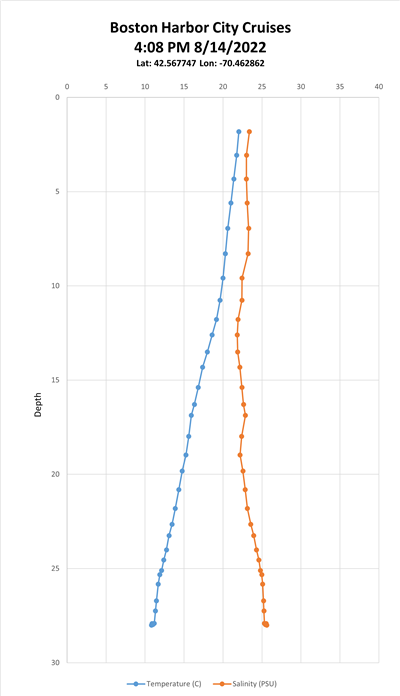
It is interesting to see how different parts of the Gulf of Maine can be unique in the sense of what the water column looks like. Uniformly mixed waters tend to show a fairly straight vertical line while curved lines tend to indicate layering of water due to differences in temperature and salinity. It is also interesting to see how temperature and salinity mirror each other showing the tight relationship between the two and its impact on the density layers in the water.
What is the temperature and salinity connection?
Warmer water, since it expands, is lighter or less dense than colder water. It also tends to be less salty. The fancy oceanographic term used to identify the layer of temperature change is called the thermocline (the blue lines on the graphs).
The higher the salinity the more salt in the water and makes the water heavier or denser than freshwater. Colder water tends to be more salty. The fancy oceanographic term used to identify the layer of salinity change is called the halocline (the orange lines on the graphs).
Seasonal changes: In the Gulf of Maine, typically the thermocline, or well defined temperature layer, is more drastically observable in the summer, because water is not mixed as much. During the spring and fall, there are offshore storms that mix the water, hence affecting the thermocline and halocline or well defined salinity layer. But depth and location can also make seasonal changes vary, as compared to Bar Harbor vs Boston. The Bar Harbor Whale Watch cast, further north in the Gulf of Maine and deeper in depth, shows the water column is fairly evenly mixed water, where the shallower Stellwagen Bank shows visible water layers (ie the thermocline and halocline lines are slightly more visible) or what is known as stratification.

So back to how this connects with whales…
Food! One of the major reasons whales are in the Gulf of Maine is the high abundance of prey. Whales rely on phytoplankton blooms to sustain the zooplankton and/or schooling fish they consume from spring to fall.
The water temperature and salinity must be within a certain range for phytoplankton bloom. Ocean mixing is important for moving nutrients through the water. These nutrients, such as nitrogen and phosphorus, are key to spring phytoplankton and zooplankton as they provide what they need to grow and reproduce. The phytoplankton and zooplankton in the Gulf of Maine are larger than in the tropics and have a higher demand for nutrients in the water column.

Copepods, a rice-sized zooplankton are vital prey for the Gulf of Maine ecosystem, rely on colder temperatures along the bottom in the winter months. Cooler bottom temperature is part of their hibernation or diapause stage. Scientists are looking at how their population is being impacted through amplified changes in water quality. This includes warming of both the surface and deep water layers.
During the time of the casts (mid-August), on Stellwagen Bank the crew observed sandlance, mackerel, and herring while offshore of Bar Harbor, Northern krill were more evident (as seen in the lovely bubble gum pink color of the humpback’s poop in photo above). We also were able to observe prey in the water column on our fish finders in the same areas we would do a cast (as seen on the photo to the right)

Certain species tend to be found in certain locations due to water quality and other physical parts of their habitat. Overtime, the information collected by the CTDs can provide clues as to what is going on in the Gulf of Maine and how whales and other wildlife life may be impacted by changes in types of water entering and circulating around the Gulf of Maine.
Overall, the information being collected by this citizen science project is helping scientists track changes occurring in the Gulf of Maine, obtaining data that would otherwise be difficult and expensive to get. This includes seasonal changes to when plankton blooms are occurring and movement of species within the Gulf of Maine. As the Gulf of Maine is one of the fastest warming bodies of water on the planet, these data are vital to help scientists track how warming water affects the water column and the vital prey sources our large whales need to thrive. So every little bit of citizen science goes a long way to help us monitor this ecosystem.
Want to get involved?
If you are affiliated with a whale watching company and are interested in using CTD’s to collect data on your vessels, please contact Tammy Silvia, Research Marine Ecologist with Stellwagen Bank National Marine Sanctuary: tammy.silvia@noaa.gov.
To learn more about ocean layers and how they change, check out these great resources:
Sources:
Andrew J. Pershing, Michael A. Alexander, Damian C. Brady, David Brickman, Enrique N. Curchitser, Antony W. Diamond, Loren McClenachan, Katherine E. Mills, Owen C. Nichols, Daniel E. Pendleton, Nicholas R. Record, James D. Scott, Michelle D. Staudinger, Yanjun Wang; Climate impacts on the Gulf of Maine ecosystem: A review of observed and expected changes in 2050 from rising temperatures. Elementa: Science of the Anthropocene 21 January 2021; 9 (1): 00076. doi: https://doi.org/10.1525/elementa.2020.00076
Deese-Riordan, H. E. (2009, December). Salinity and stratification in the Gulf of Maine: 2001-2008 . ResearchGate. Retrieved January 10, 2023, from https://www.researchgate.net/publication/277873365_Salinity_and_Stratification_in_the_Gulf_of_Maine_2001-2008
Sigman, D. M. & Hain, M. P. (2012) The Biological Productivity of the Ocean. Nature Education Knowledge 3(10):21